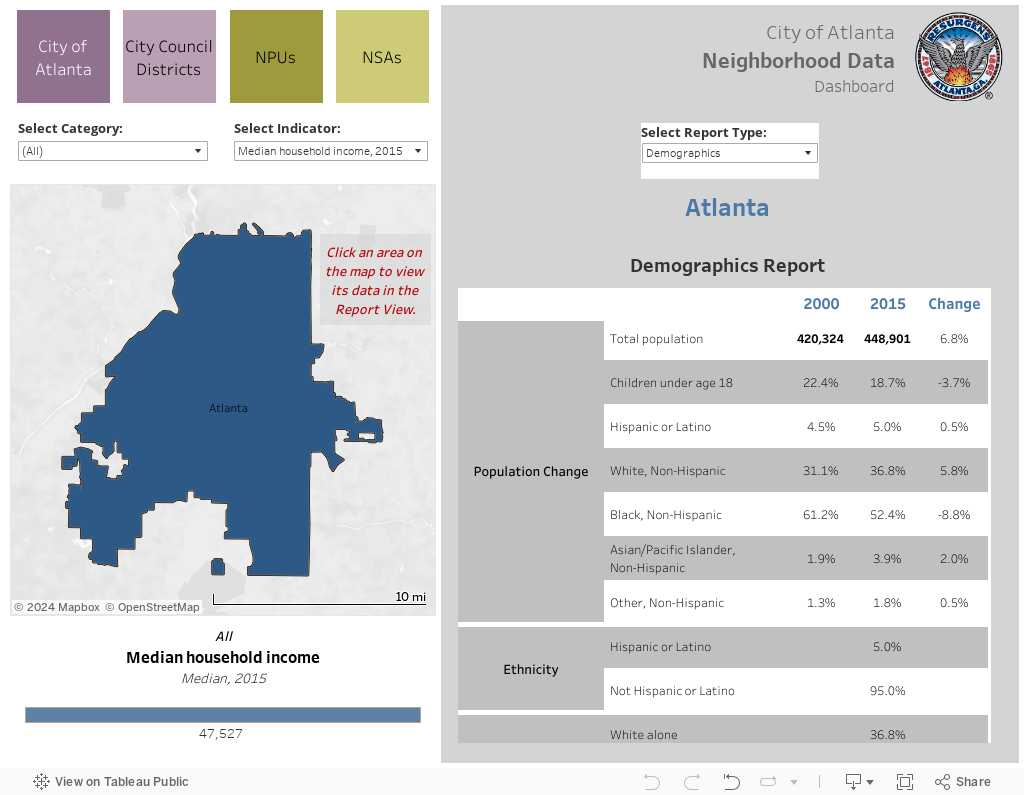
The City of Atlanta data visualization suite includes 400 variables all mapped to City of Atlanta neighborhoods, neighborhood planning units (NPUs), and City Council districts’ boundaries. The data includes several City-specific variables such as code enforcement, 911 calls and the results of the recently-conducted windshield survey of housing conditions, as well as hundreds of Census variables like income, poverty, health insurance coverage and disability. When we say “neighborhoods”, we actually mean “Neighborhood Statistical Areas,” which in some cases combine some of Atlanta’s smaller neighborhoods into one.
The tools we built include an interactive map, which allows for a deep-dive analysis of all 400 variables, and a dashboard, which is an easy-to-use tool that provides quick comparisons of every neighborhood, neighborhood planning unit, and City Council district to the city as a whole.
Visit the City of Atlanta’s website.
Data Dashboard
The Data Dashboard enables the use to find and map key indicators for every neighborhood, NPU, and City Council district within the City of Atlanta. The tool includes both an interactive map and report interface. The map interface enables the comparison between geographic areas within the city based on a drop-down selection of numerous indicators across and an array of categories. The report portion of the tool enables a closer look at a chosen geographic area (selected using the map) and can be tailored to the user’s specific topic of interest with pre-formatted report types.