Neighborhood Socializing Has Fallen Sharply Since 2012—Especially Among Young Adults
The American Enterprise Institute Survey Center on American Life released Strangers Next Door, a new national survey exploring how Americans interact with their neighbors and communities. Based on responses from more than 5,300 adults, the report finds that neighborhood socializing has declined significantly over the last decade, especially among young adults and people without college degrees. The data also highlights how access to community spaces, education, and religious participation shape trust, belonging, and social connection.
Key takeaways:
- Only 40% of Americans say they regularly talk with their neighbors, down from 59% in 2012. Among young adults, that share fell from 51% to just 25% over the same period.
- Americans with college degrees report stronger neighborhood ties across nearly every measure: 58% spent time socializing with neighbors in the past year compared to 46% of those without a degree, and 81% say they trust their neighbors versus 64% among those with a high school education or less.
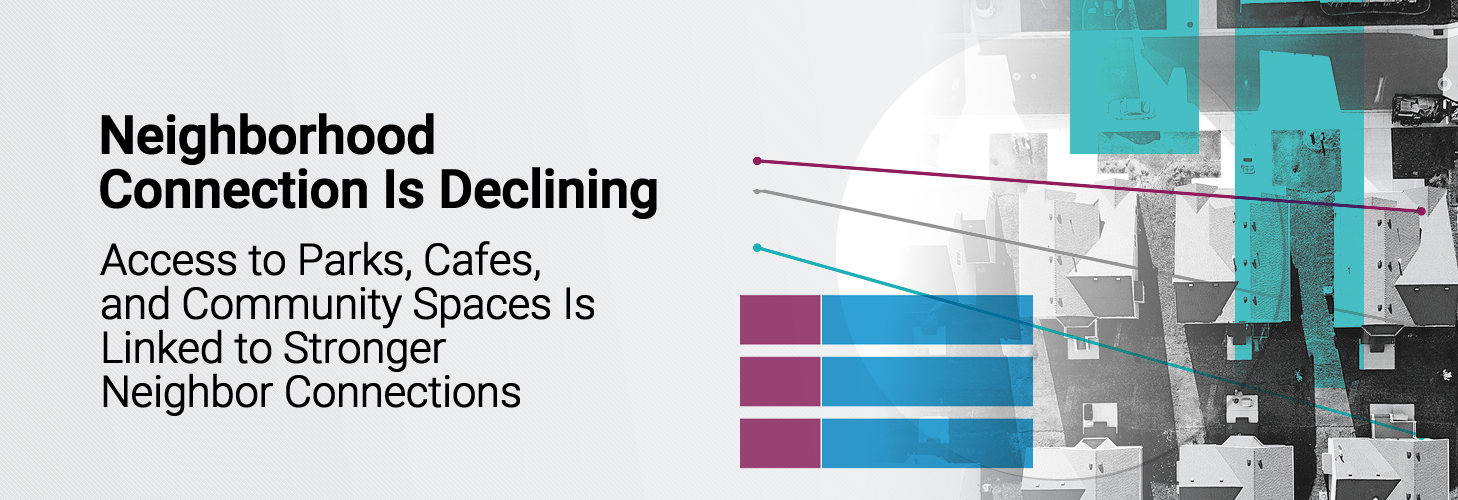
- Access to “third places” like parks, coffee shops, libraries, and community centers is closely tied to neighborhood engagement. Americans with six or more nearby gathering spaces are much more likely to regularly interact with neighbors than those with few or none.
Read the full article here.