The crisis that Atlanta and Georgia and the world is facing is a unique threat in its scale and urgency; however, the opportunities it presents are also significant. The covid-19 pandemic is shining a light on systemic inequities and historic blindspots—whether unknown or unacknowledged—and our response could inform our approach to addressing long-term systemic change.
The effects of the covid-19 pandemic immediately developed into concurrent public health and an economic crises. Thus, medical and economic interventions are necessary, especially for those families finding themselves at the intersection of both.
As such, we at Neighborhood Nexus have been working with public agencies, nonprofit service providers, and the philanthropic community to provide data-informed analysis and guidance. From creating maps and tools, conducting economic modeling to inform policy decisions, and supporting relief funds and planning efforts, we’re here for you. Please reach out anytime to tpearce@atlantaregional.org.
Below, we’ve organized critical data and resources regarding Georgia’s most vulnerable populations as you and other agencies work to provide relief over the coming weeks and months. Here, you will find:
- information on vulnerable populations, including health and economic indicators
- economic impacts
- covid-19 incidents and mortality trends
- analysis into social patterns
- a list of other community resources.
More community data can be found throughout our site, especially on our mapping page and the 33n blog.
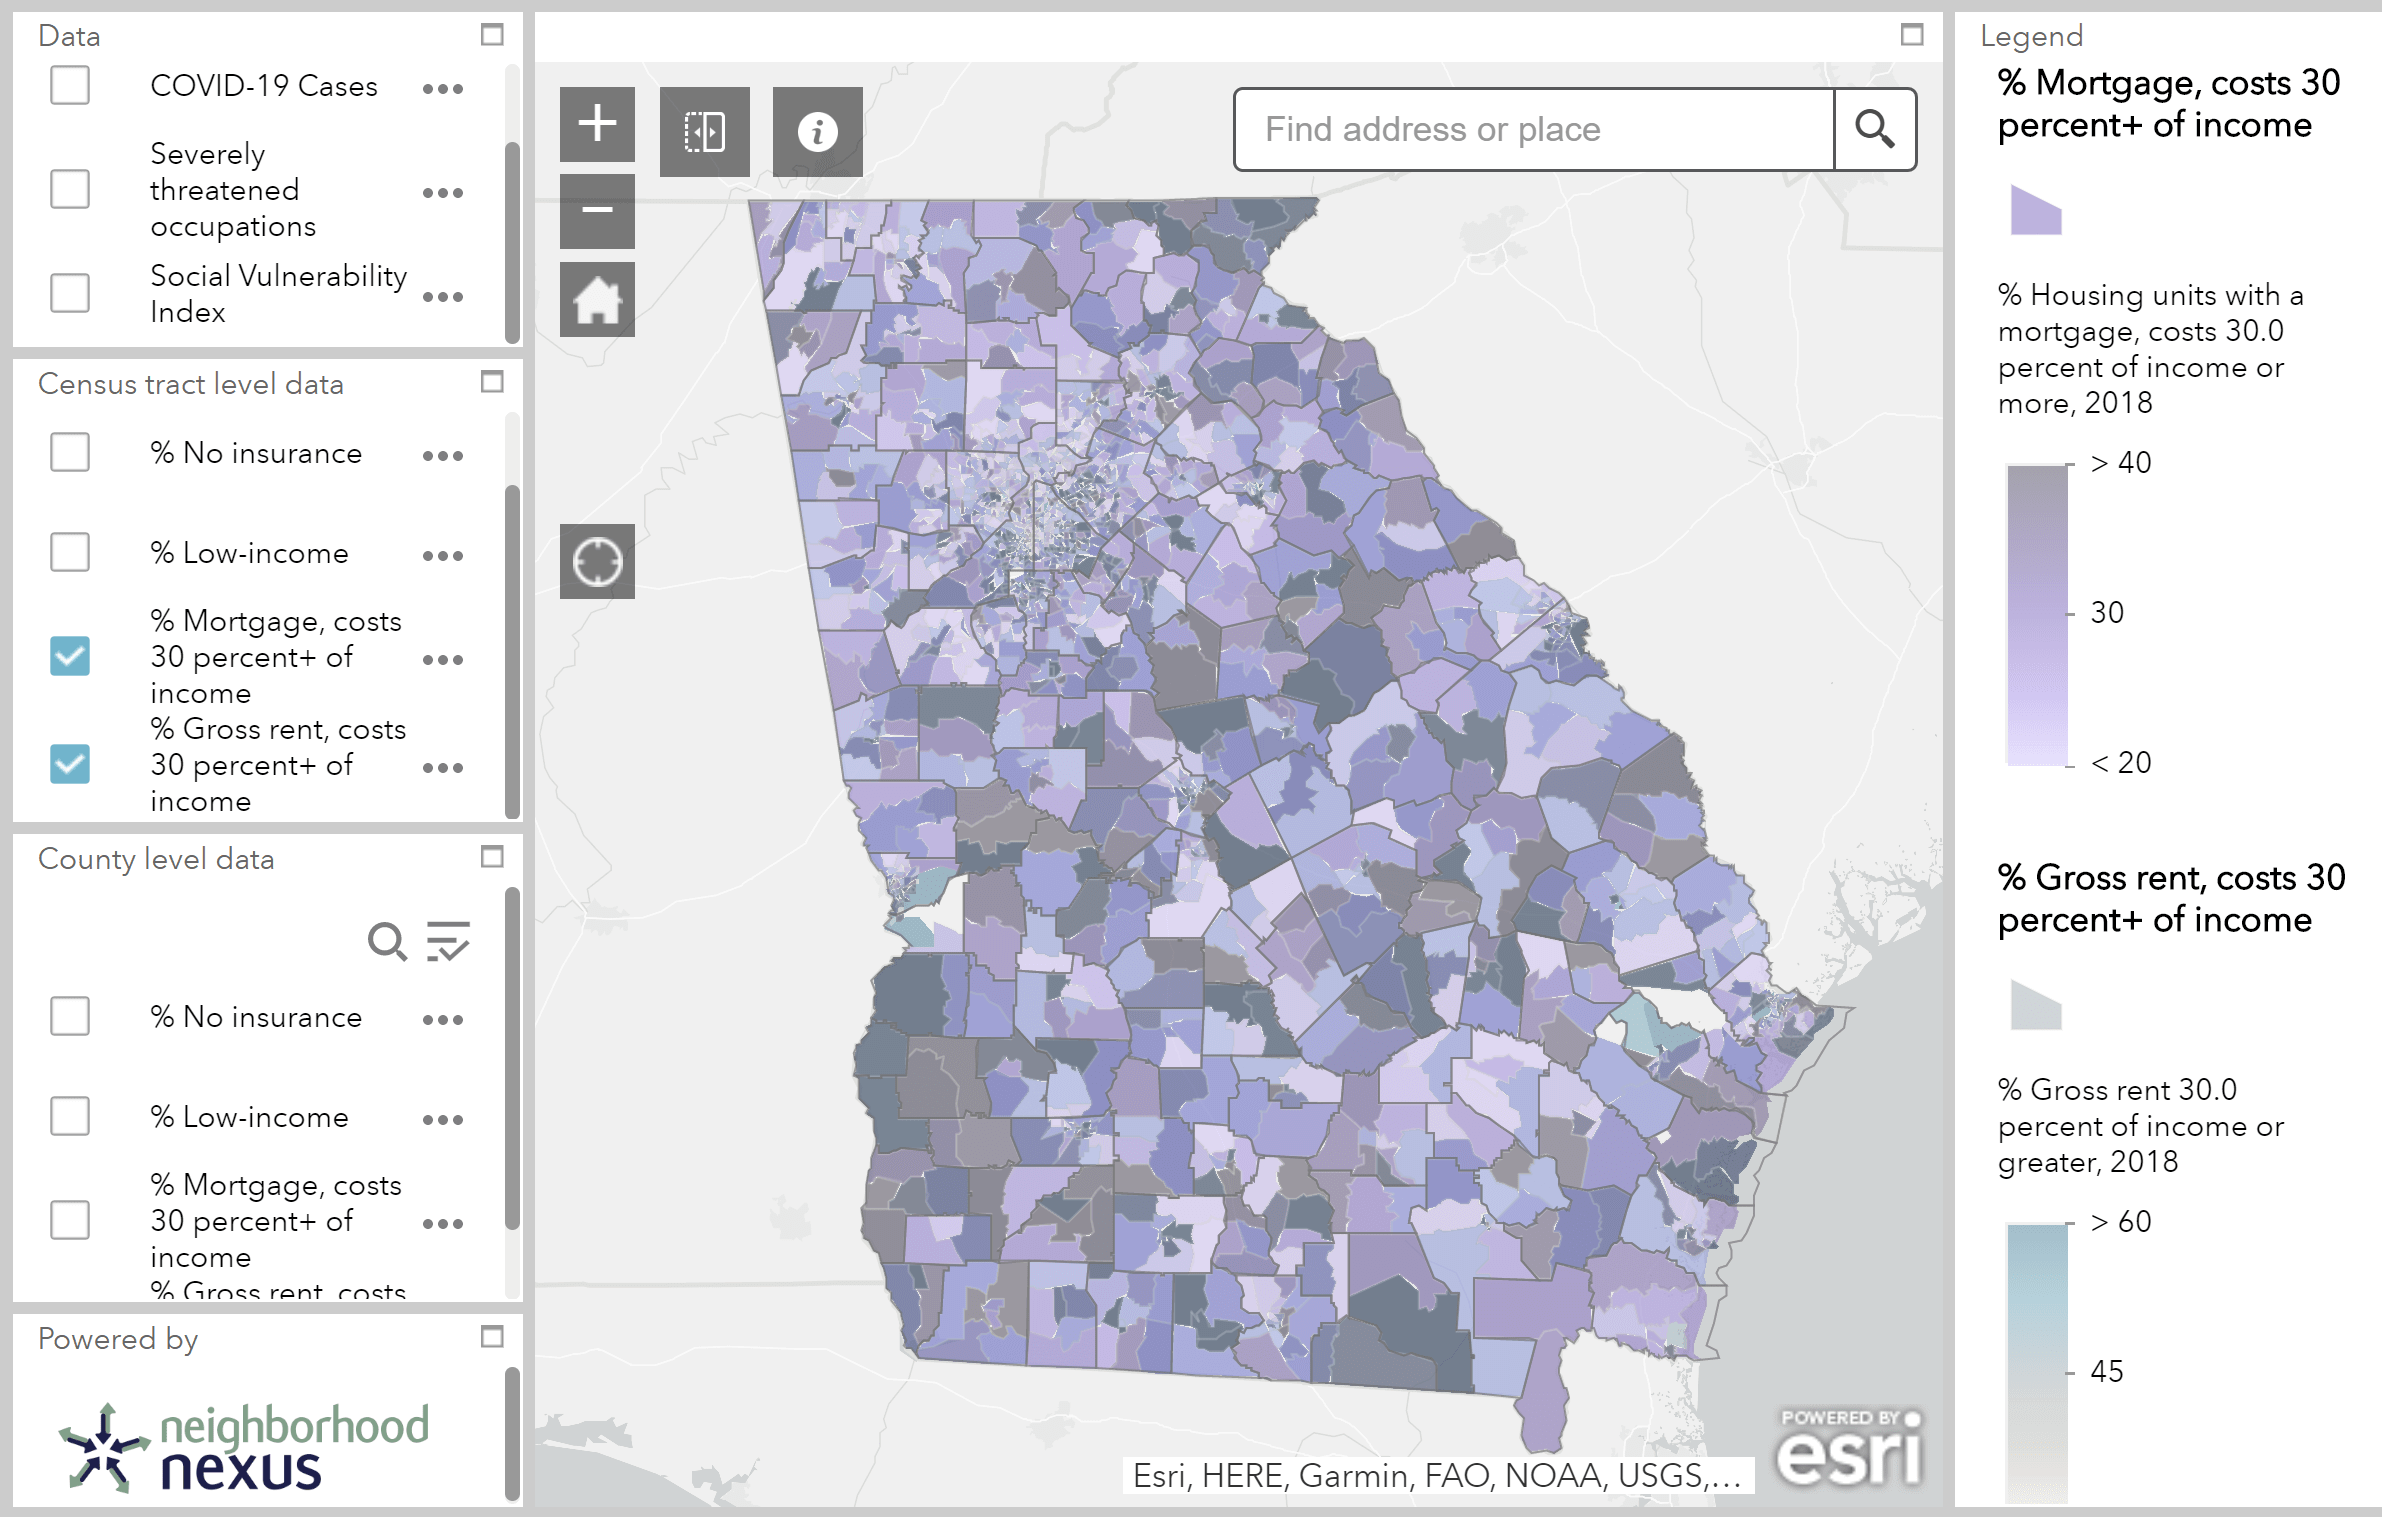
Vulnerable Populations
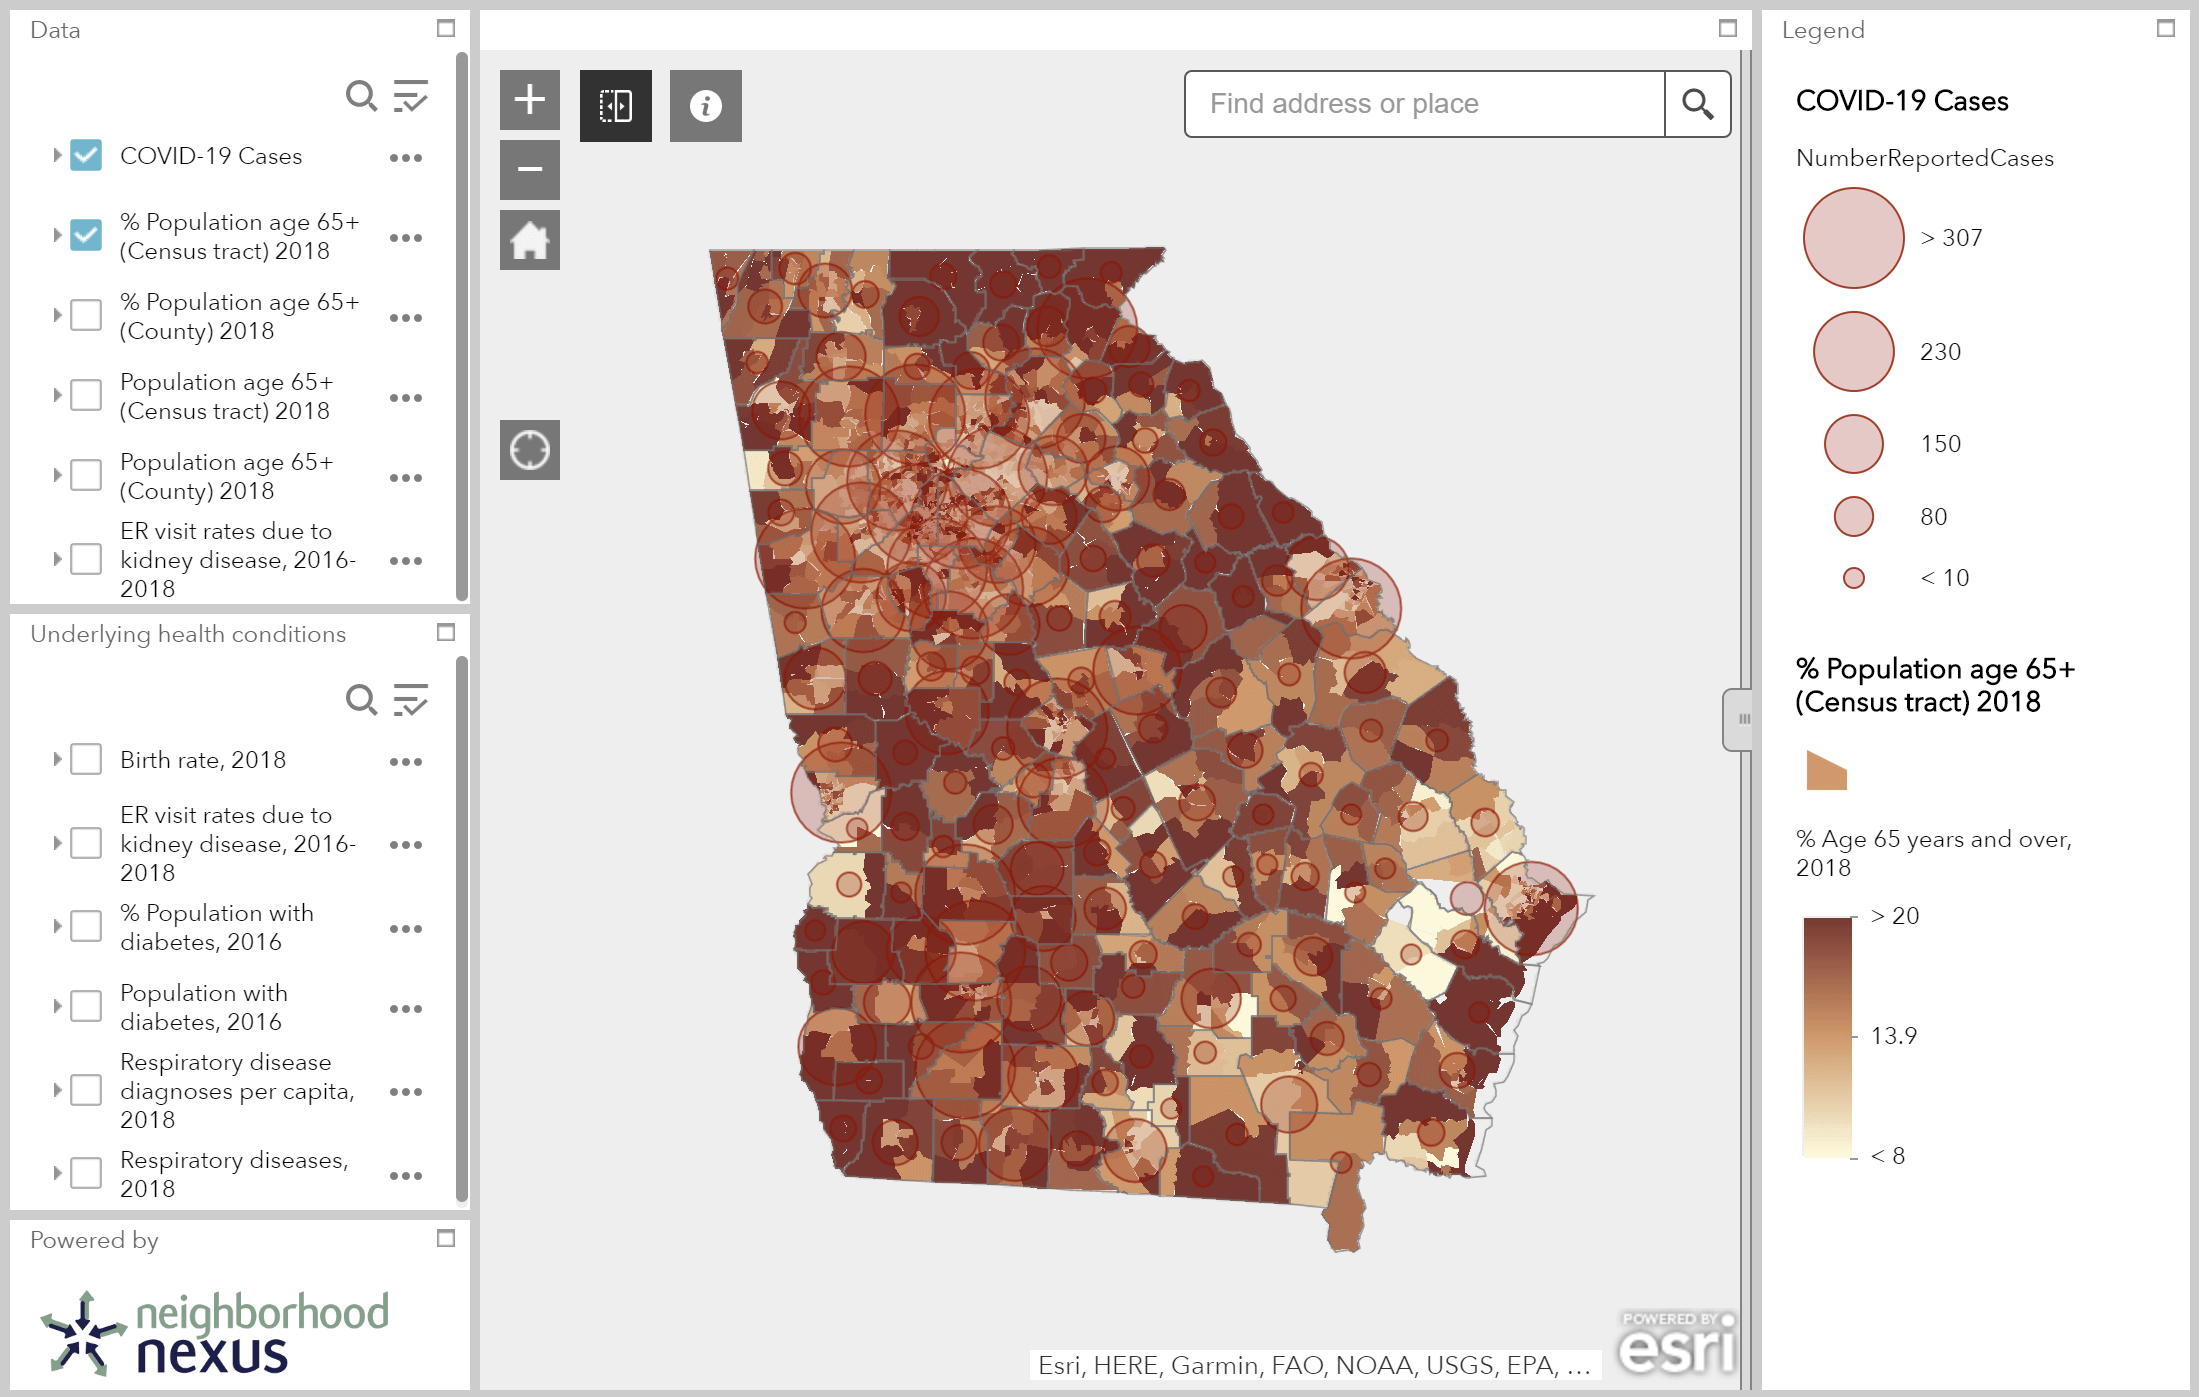
The following maps look at indicators relating to high-risk groups, according to the CDC and economic analysis. Use these tools to identify individuals, families, and local partners. Click the images to open full-screen interactive tools.
| Medically Vulnerable | Economically Vulnerable |
 |
 |
Click the image below to visit the Atlanta Eviction Tracker, a dashboard of up-to-date eviction filings in the metro region.
![]()
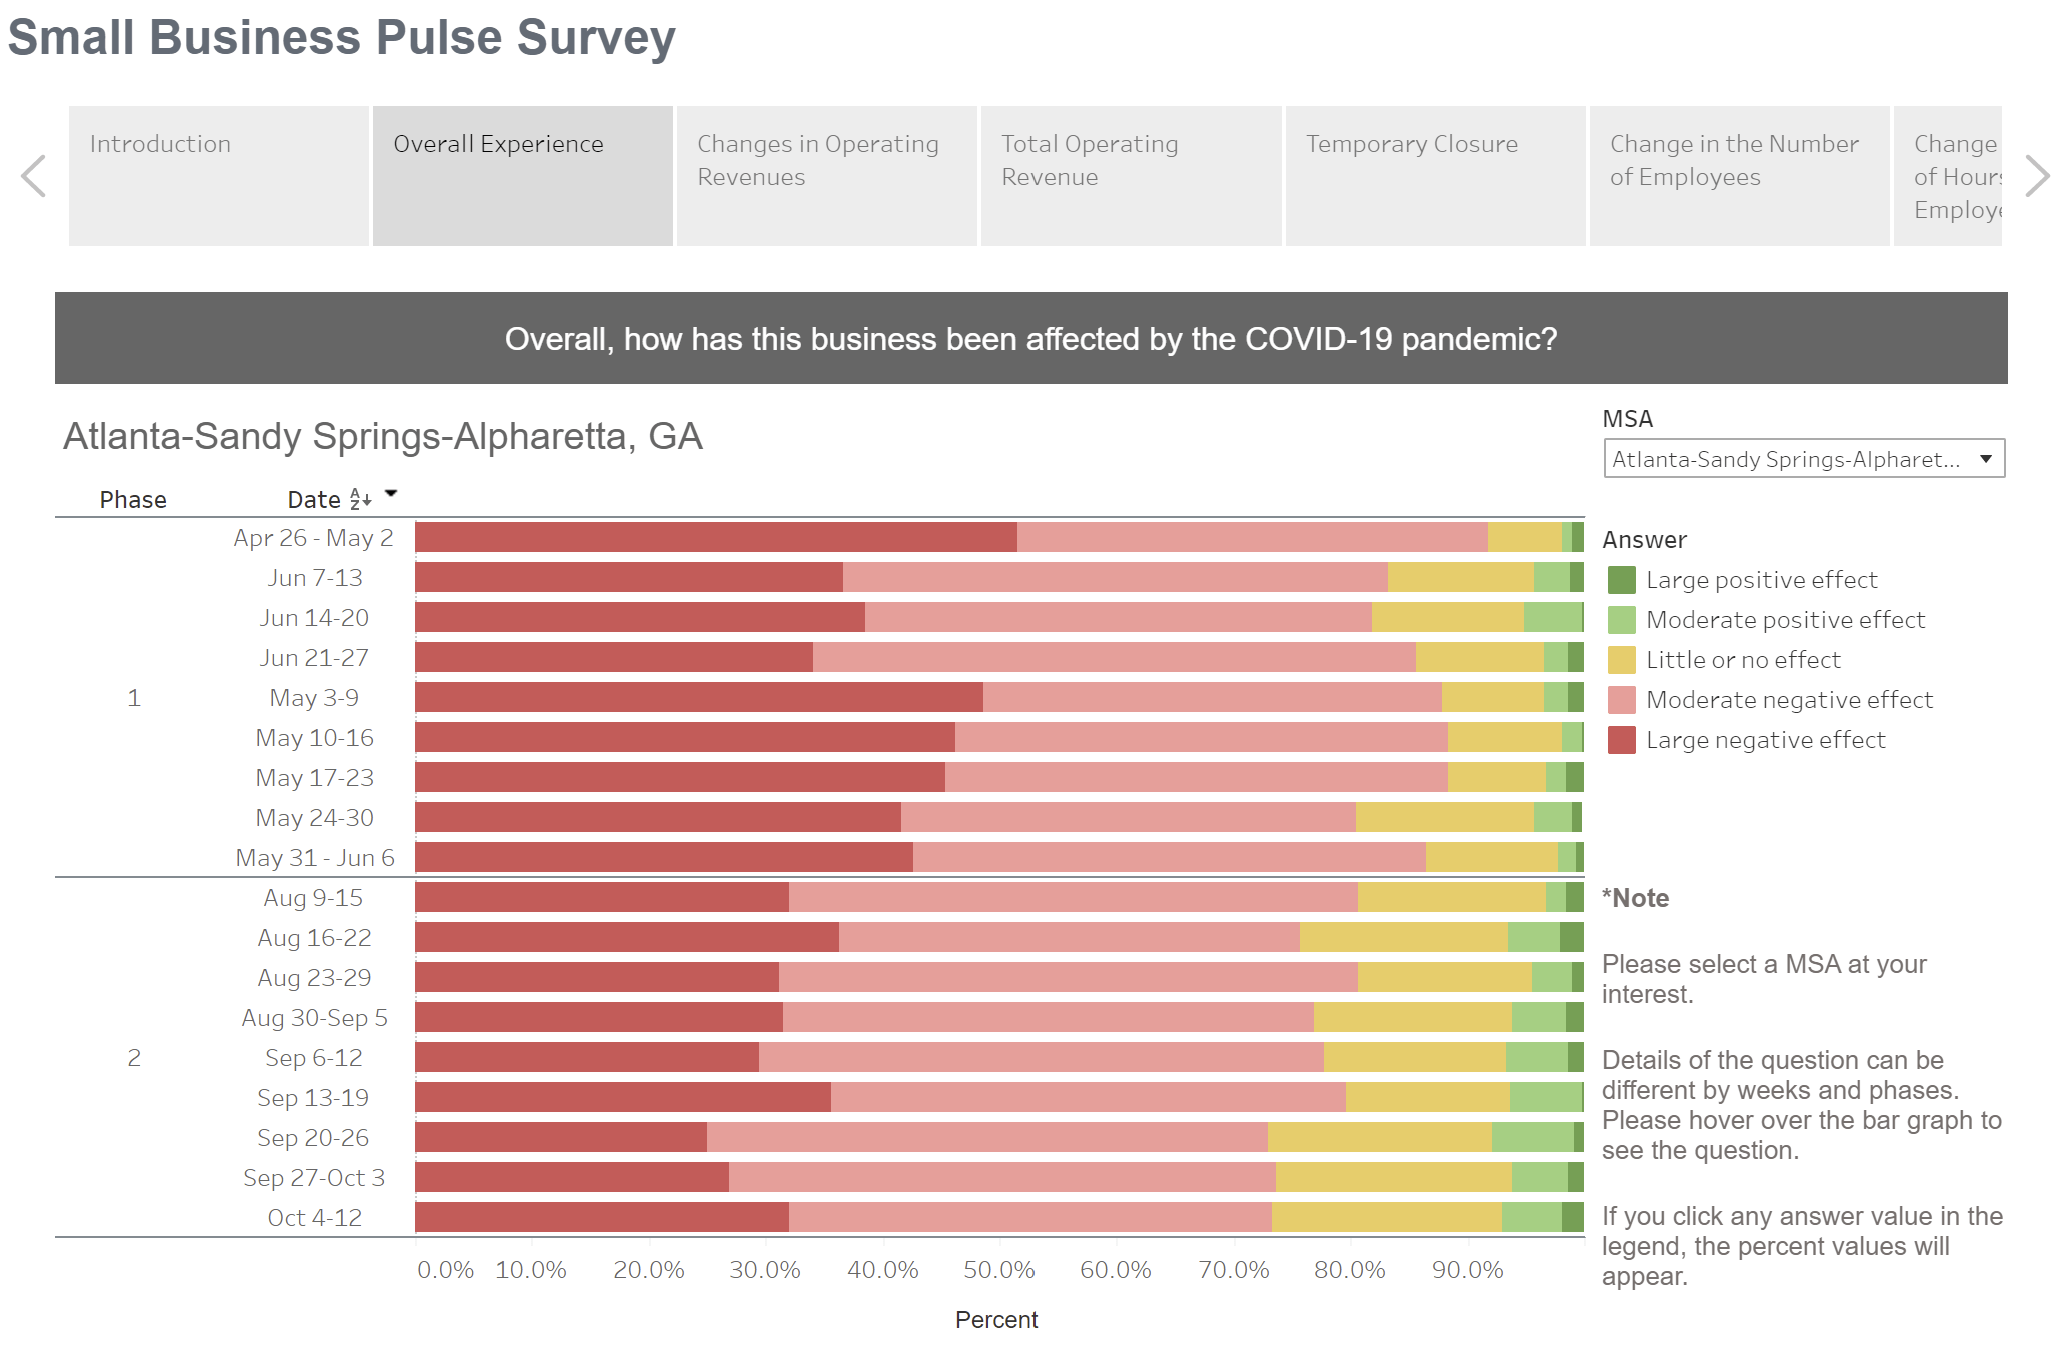
Evaluating Economic Impact
Below is an interactive dashboard tracking Metro Atlanta findings from the Census Bureau’s small business pulse survey.
The following chart illustrates the size and average wages of severely threatened industries in the Atlanta MSA. Employment and wage data are from 2018. These industries’ vulnerability status will is based on our analysis and will continue to be updated as we learn more from industry data and conversations with key stakeholders.
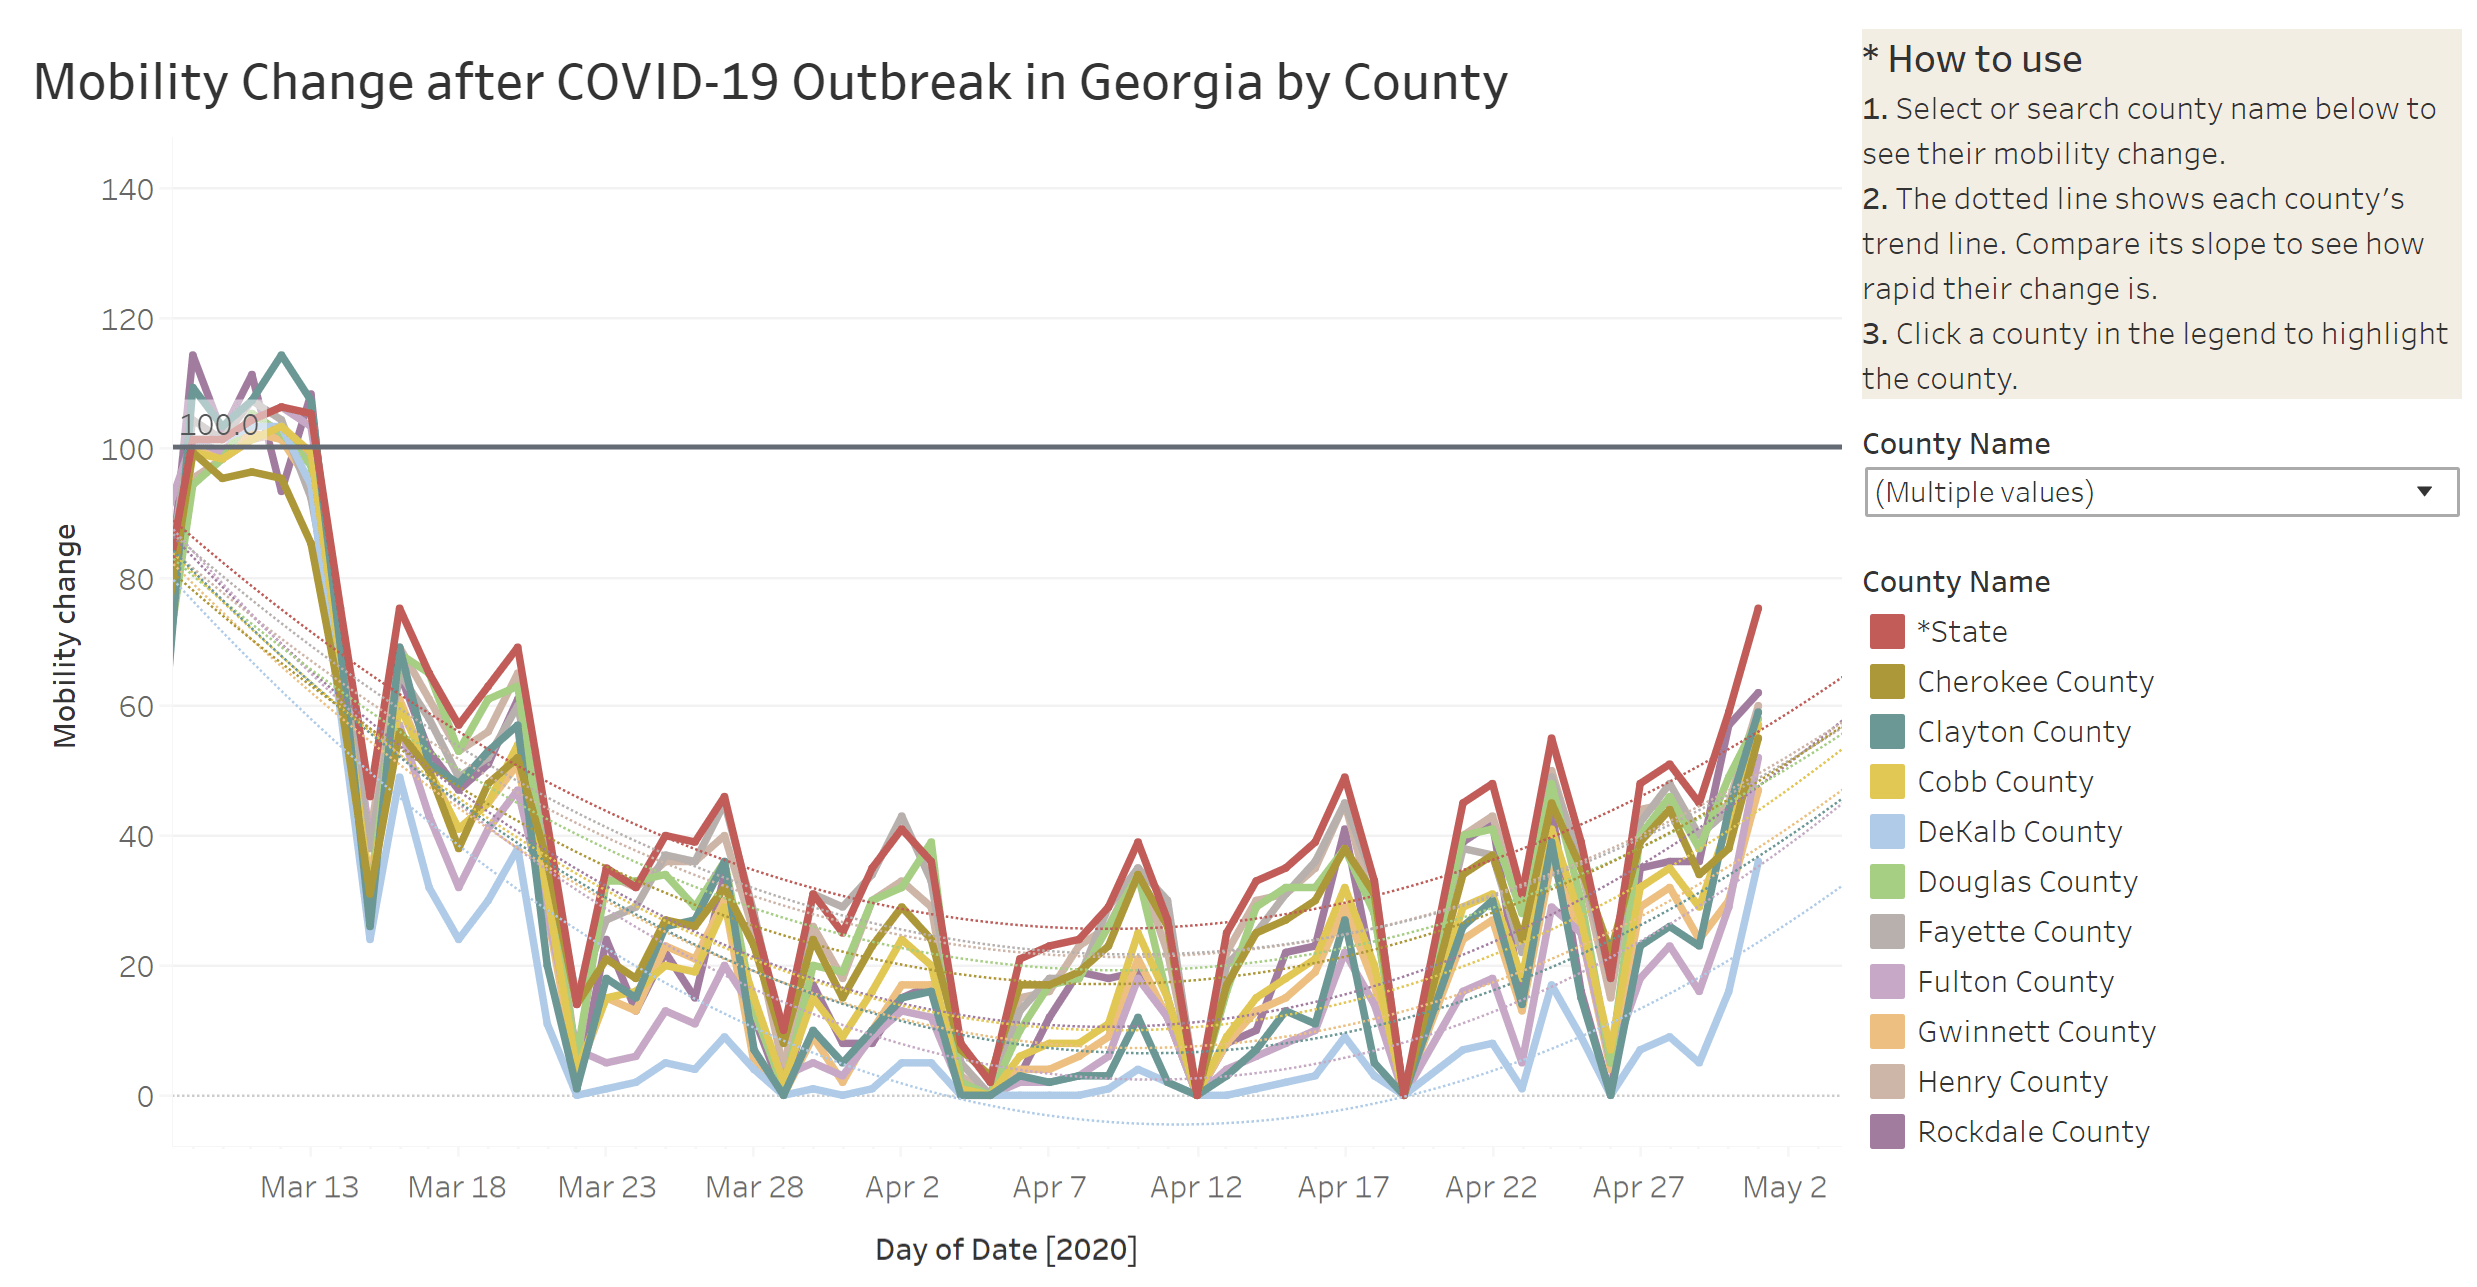
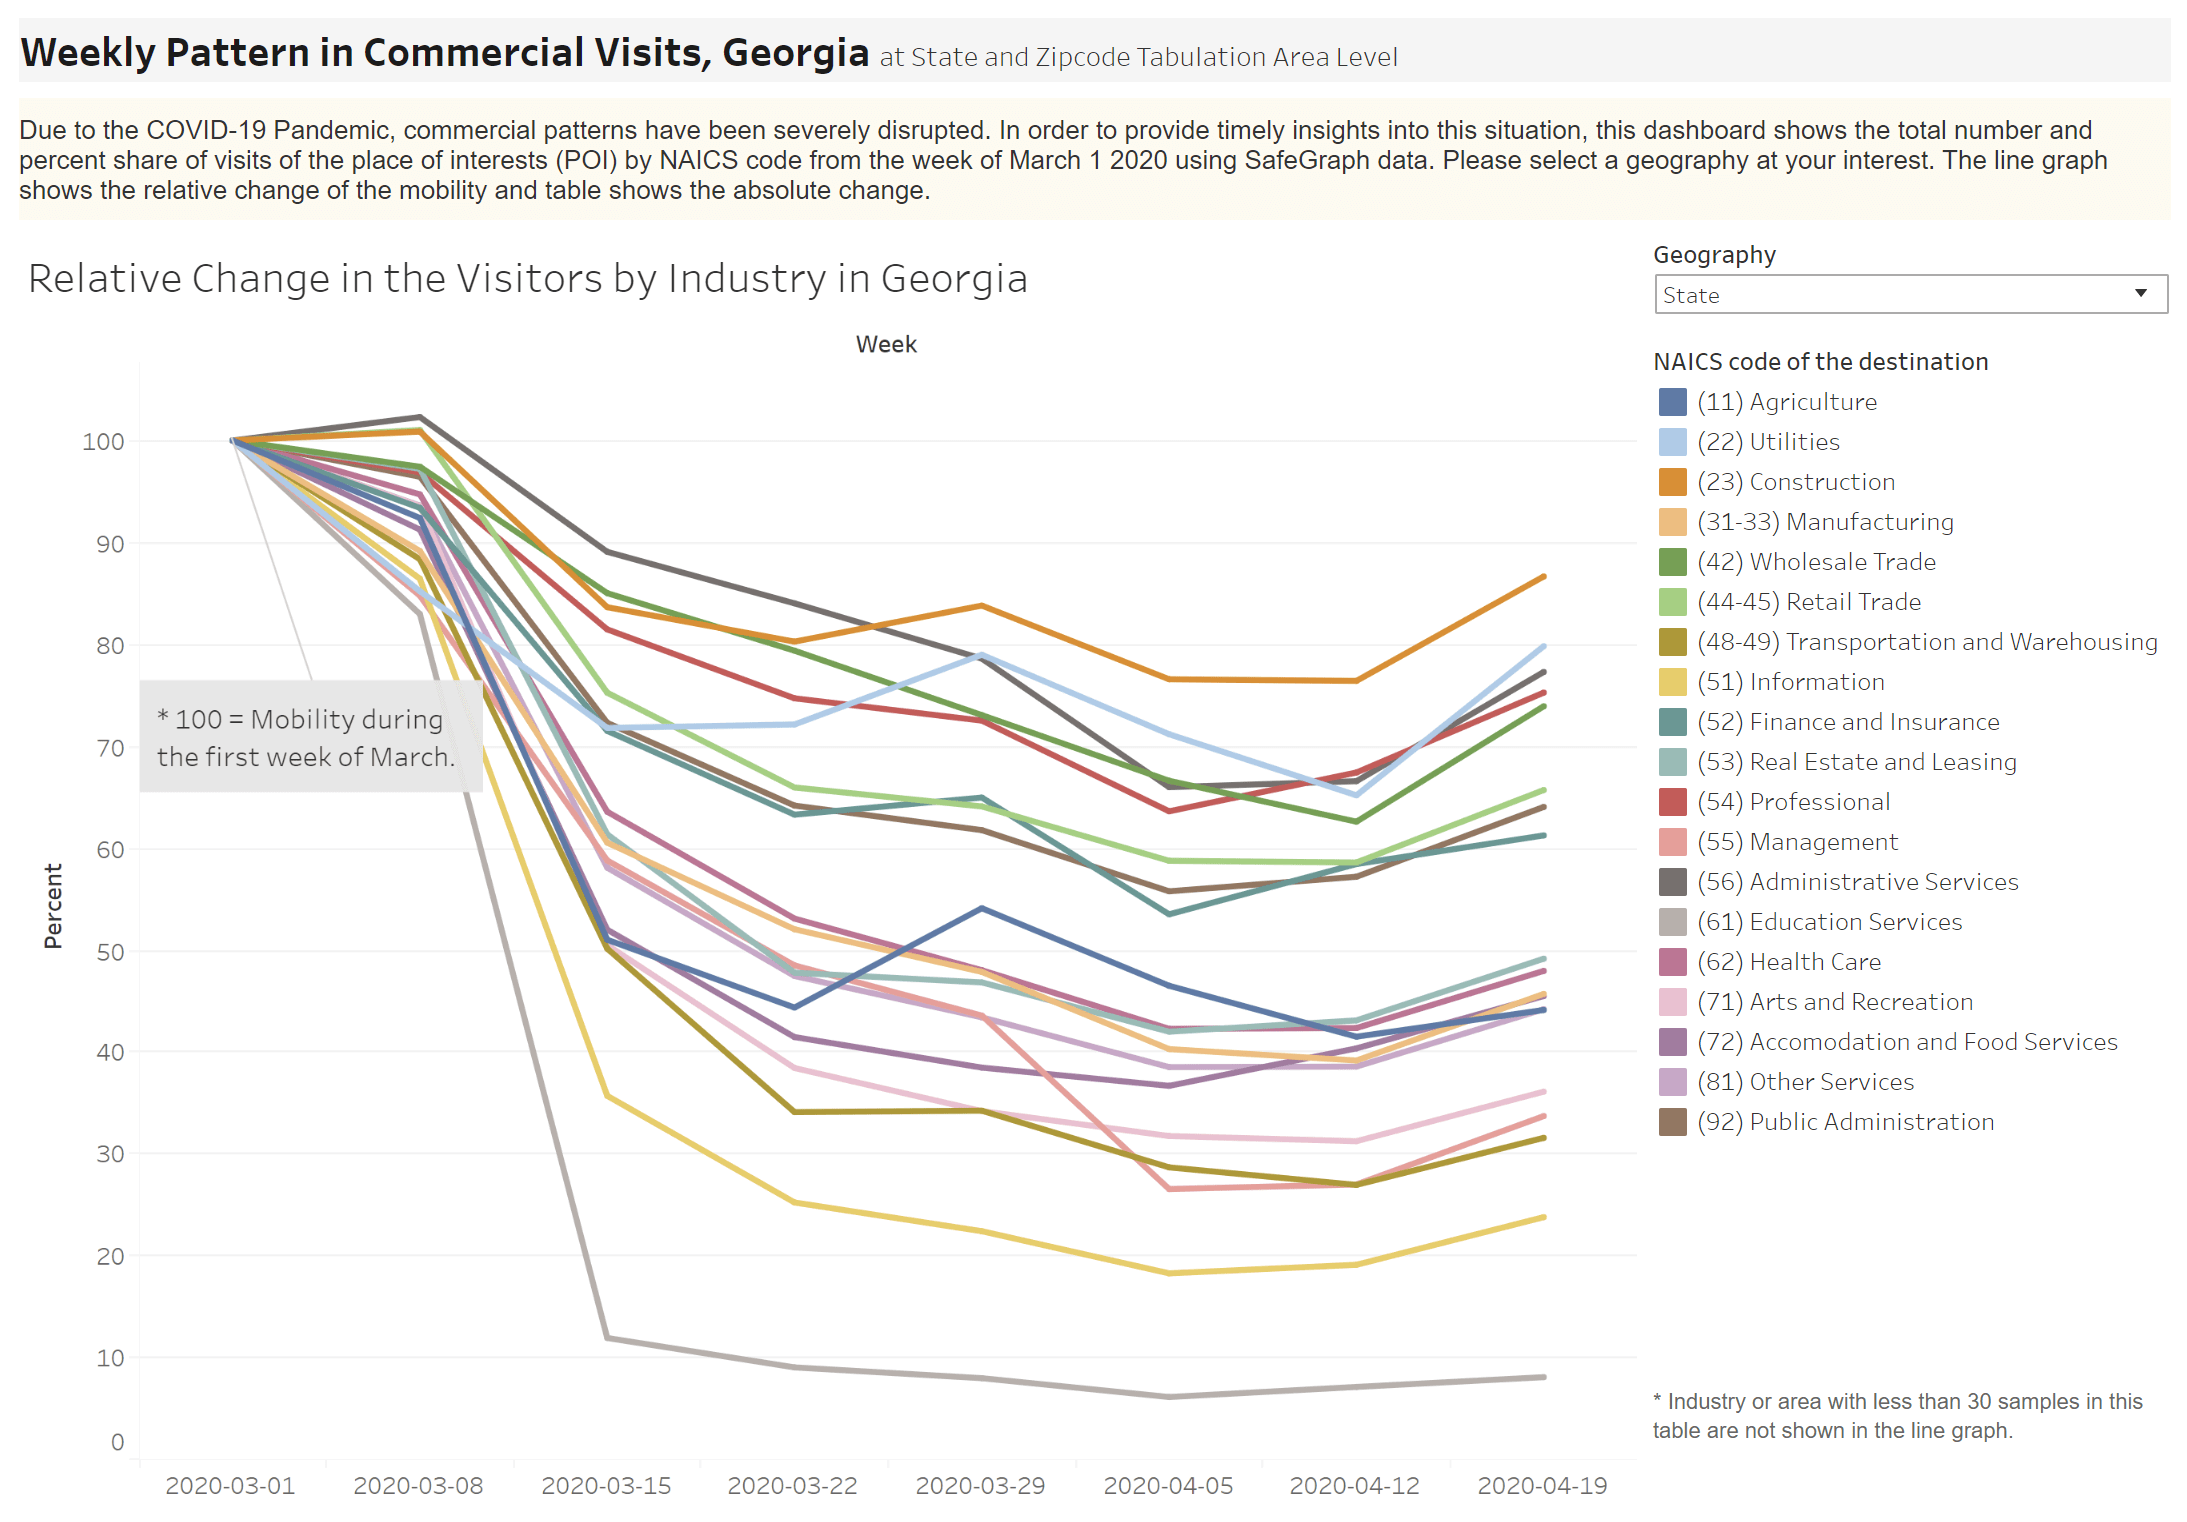
COVID-19 Data and trendsThe following two dashboards look at key indicators and projections of covid-19 over time. These Atlanta Regional Commission apps can be be viewed in full screen by clicking the images below. Local, regional, and state indicators and projections. (Click image to open.) Social Distancing and Mobility Patterns
Community ResourcesIf you or someone you know is in need of critical resources or services, call 2-1-1 or visit 211online.unitedwayatlanta.org. For additional guidance and resources, visit these pages:
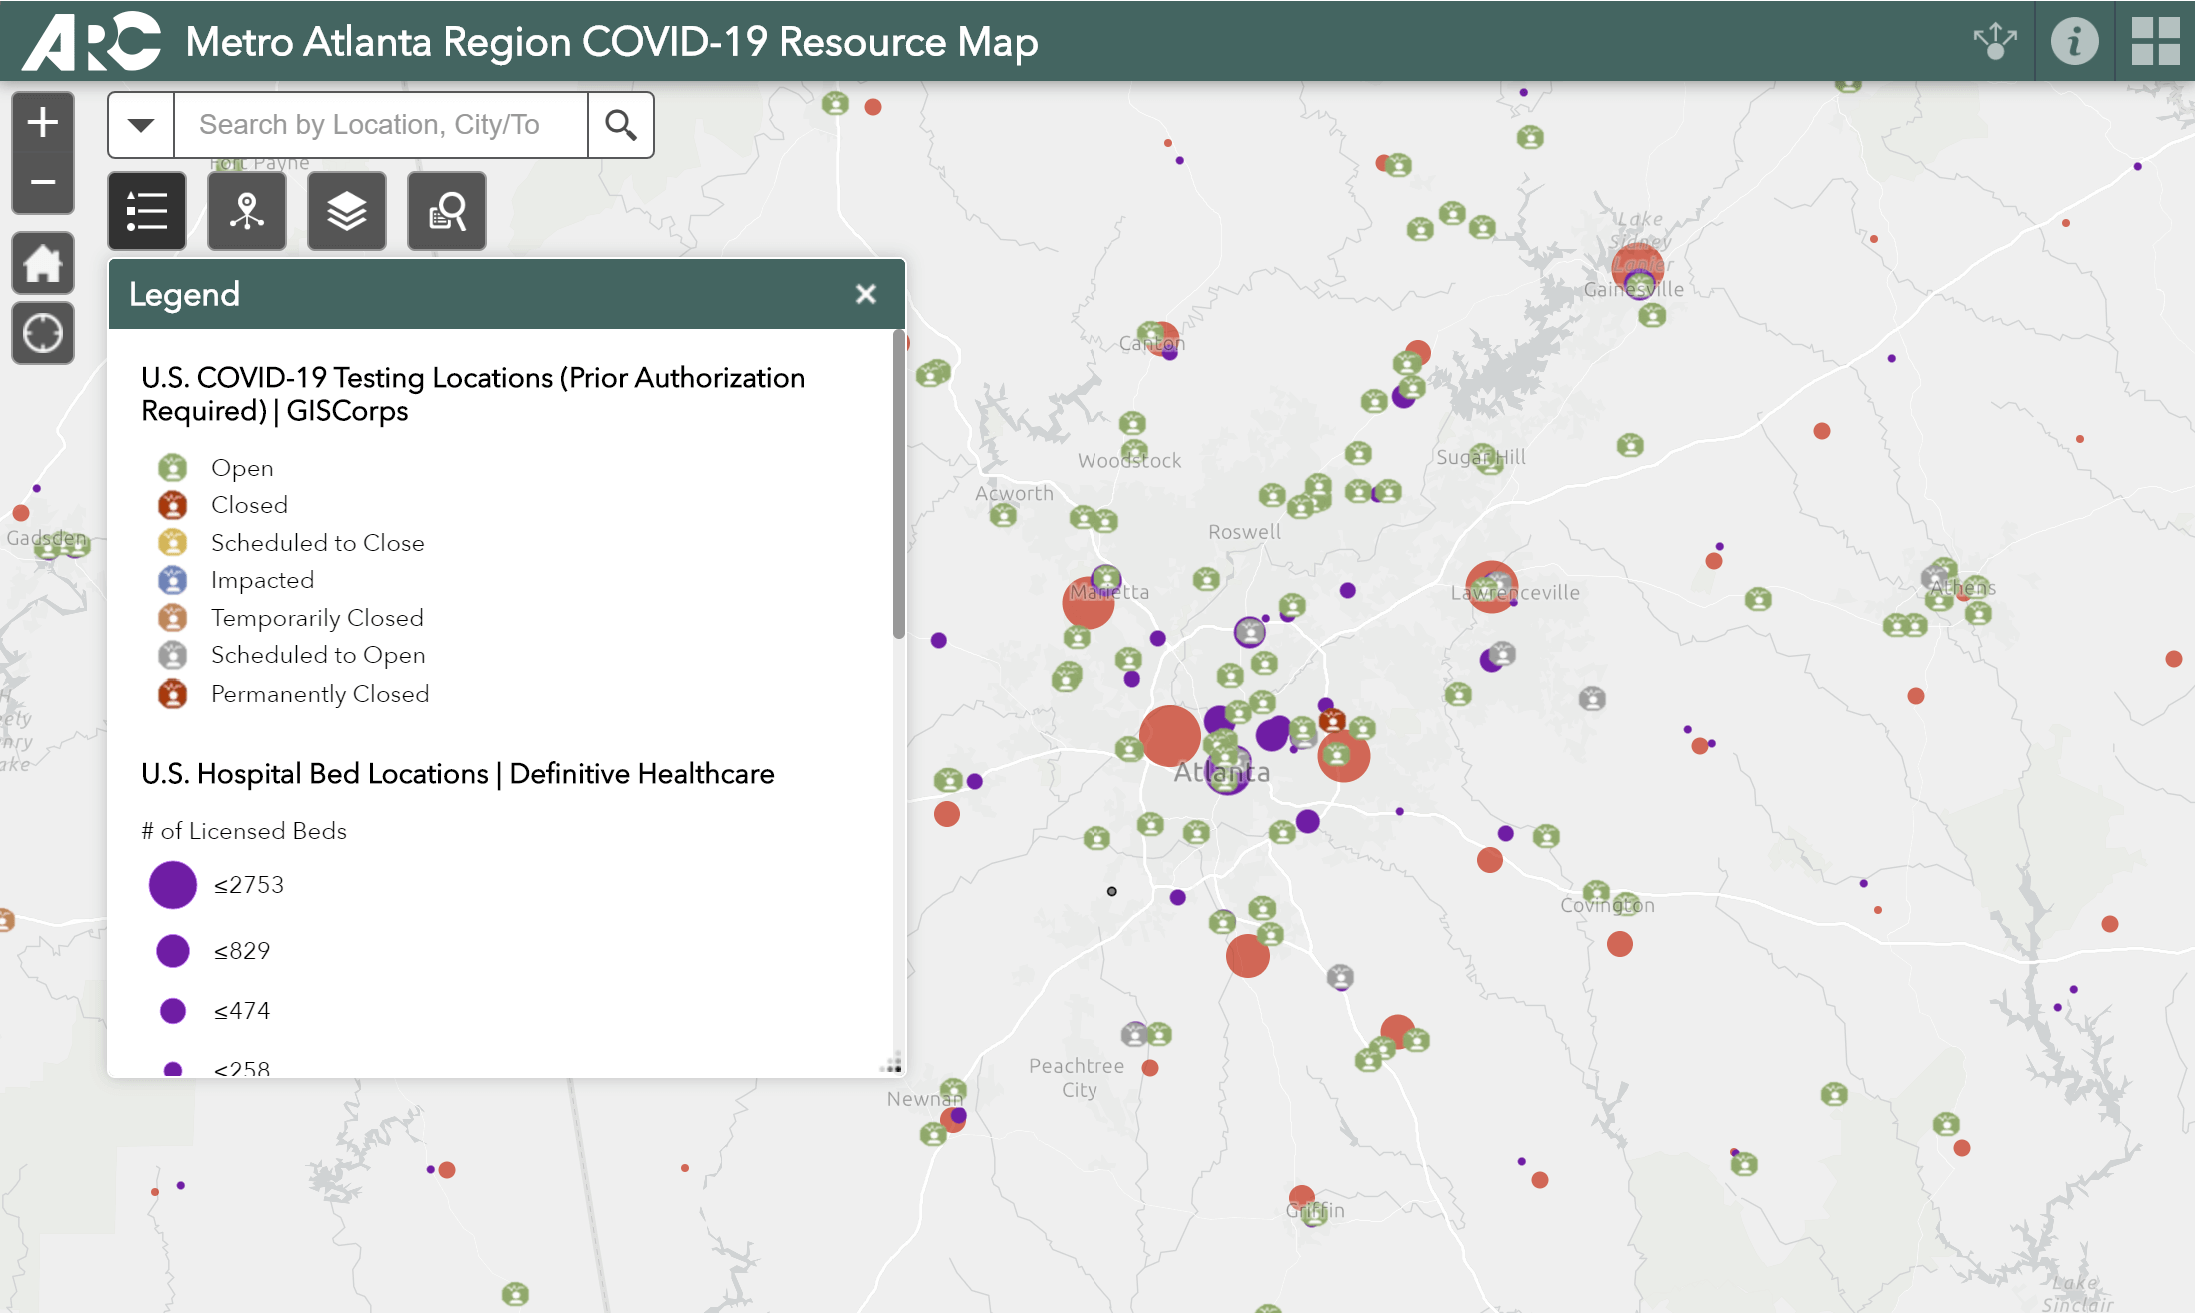
Testing sites, hospital beds, and other community resources |