February 24, 2026 / Basic Needs, Housing

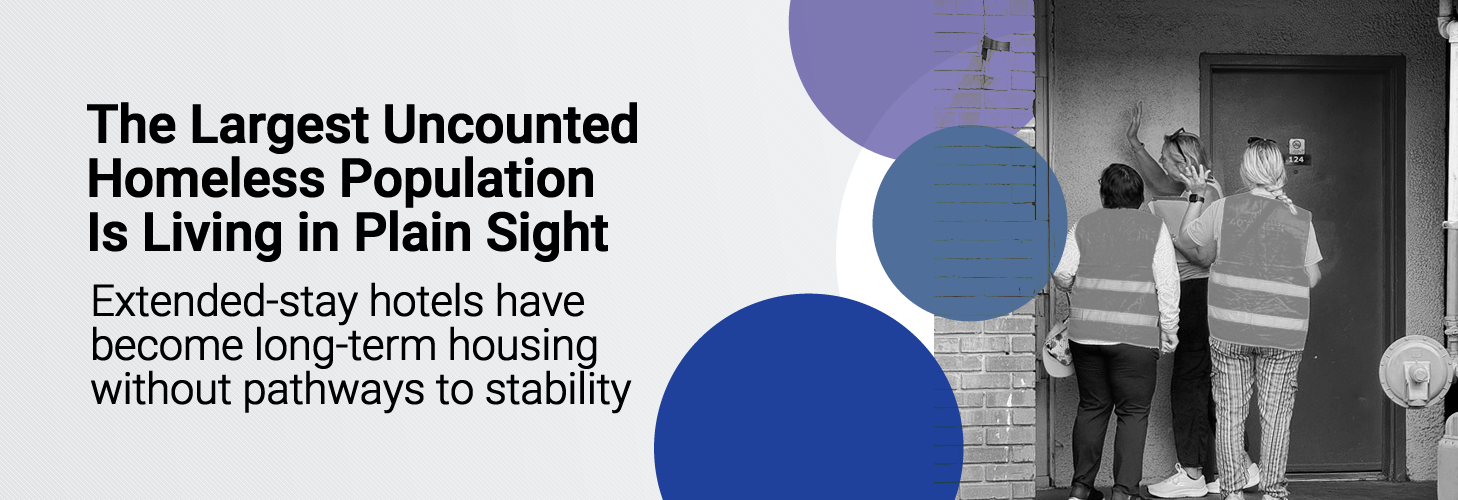
A Major Share of Local Homelessness Is Hidden in Extended-Stay HotelsImage

A January 2026 countywide assessment led by the Single Parent Alliance & Resource Center (SPARC), in partnership with the Georgia State University’s Center on Health and Homelessness and School of Public Health, set out to document and better understand families living in extended-stay hotels across DeKalb County. Through door-to-door enumeration, surveys, and analysis of living conditions, the project captures a population largely excluded from traditional homelessness counts, providing new evidence on the scale, drivers, and daily realities of this form of housing instability, and revealing critical gaps that have implications for policy, funding, and service delivery.

Key findings:

  • A hidden population far larger than official counts: An estimated 4,664 people — including 1,635 children — are living in extended-stay hotels, far exceeding Continuum of Care and school system counts, revealing a major gap in how homelessness is measured.

  • Hotels as de facto long-term housing: Extended-stay properties are functioning as permanent housing because existing systems offer few pathways into stable, affordable homes.

  • Economic shocks drive displacement: Evictions, rising rents, and job disruptions — not individual failings — are the primary reasons families end up in hotels, pointing to structural drivers of housing instability.

  • Families pay more for less stability: Monthly hotel costs often exceed local apartment rents, meaning families are paying above-market prices for a single room without tenant protections or long-term security.

  • Most families are working but blocked by barriers: Despite high employment rates, upfront costs, income thresholds, and credit requirements prevent families from securing leases, trapping them in a cycle of temporary housing.

  • Implications for planning and resource allocation: Excluding these families from official counts risks underestimating need and misdirecting funding, while the new data provide a stronger foundation for targeted housing strategies and prevention efforts.

Read the full report here.

August 25, 2025 / Basic Needs

45% of Georgia Families Live Below the ALICE ThresholdImage

The 2025 ALICE Report from United Way of Greater Atlanta shines a light on the growing number of Georgia households struggling to make ends meet. ALICE—Asset Limited, Income Constrained, Employed—households earn more than the Federal Poverty Level but still fall short of affording basic needs like housing, child care, food, transportation, and health care.

When combined with households living below the Federal Poverty Level, nearly half of all households in Georgia (45%) were living below the ALICE Threshold in 2023. That means more than 1.8 million Georgia households face impossible choices every day: pay rent or cover child care, buy groceries or fill a prescription. These families represent every demographic and county in the state, and many of them hold the jobs that keep our communities running.

Key findings:

  • In 2023, 14% of Georgia households lived below the Federal Poverty Level, and 31% were ALICE. Together, 45% of households fell below the ALICE Threshold.

  • The ALICE Household Survival Budget averaged $31,920 for a single adult and $76,884 for a family of four—more than double the federal poverty line. Costs varied significantly by county.

  • Of Georgia’s 20 most common occupations, 13 paid less than $20 per hour, and 35% of workers in these roles lived in households below the ALICE Threshold.

  • Households below the ALICE Threshold include all demographic groups, but systemic racism, ageism, gender discrimination, and geographic barriers leave some groups disproportionately affected.

  • ALICE data shows strong links between financial hardship and other well-being indicators, helping policymakers and advocates understand the broader effects on Georgia families.

Read the latest State of ALICE in Georgia here.

August 25, 2025 / Basic Needs, Policy

Baby bonds could create $1.4 billion in new wealth per generationImage

Kindred Futures’ latest policy report, Securing Georgia’s Future: How Baby Bonds Can Build Wealth and Transform Communities, highlights how a state-level baby bonds program could reshape economic opportunities for children across Georgia, particularly in rural and low-wealth communities. Baby bonds are publicly funded trust accounts for children that invest more in those born into lower-wealth households, aiming to narrow racial and geographic wealth gaps and support long-term economic mobility.

Georgia’s economy may be growing, but prosperity is unevenly distributed. In Forsyth County just north of Atlanta, the median household net worth exceeds $720,000, while nearby rural Chattahoochee County is closer to $15,000. These disparities reflect generations of unequal access to wealth-building opportunities and limit the ability of children born into low-wealth households to climb the economic ladder.

Some key insights:

  • $1.4 billion in new wealth per birth cohort: A universal baby bonds program in Georgia could generate substantial new assets for children.
  • Up to $16,000 per child by age 18: Eligible children could access funds to invest in education, homeownership, or other wealth-building opportunities.
  • Rural communities would benefit most: South and Central Georgia counties, where low-wealth births are higher, stand to gain the most from a universal baby bonds program in Georgia.
  • Advances economic mobility: Baby bonds could reduce future reliance on public assistance and help close Georgia’s racial wealth divide.

Read the policy report here.


Georgia Falls to 39th for Child and Family Well-BeingImage

Are children and families thriving in Georgia? According to the 2025 KIDS COUNT® Data Book, Georgia now ranks 39th out of 50 states—its lowest position in seven years. The report, released by Georgia Family Connection Partnership (GaFCP) and the Annie E. Casey Foundation, tracks 16 indicators across four key domains: health, education, economic well-being, and family and community. While some areas have seen progress, the data shows Georgia continues to face persistent challenges—from rising child poverty to increasing teen death rates and limited improvement in maternal and child health.

Key takeaways:

  • Child poverty rises: 18% of Georgia children lived in poverty in 2023—50,000 more than in 2022, totaling 461,000 (5th highest in the U.S.).
  • Housing burden increases: 66,000 more children live in homes spending over 30% of income on housing—an 11% rise since 2019.
  • Education concerns: 70% of 4th graders read below proficiency (up from 68%), and 76% of 8th graders scored below proficient in math—10% worse than in 2019.
  • Health challenges: Georgia ranks 47th for low birthweight (10.2% vs. 8.6% nationally), while uninsured children remain at 6%, but absolute numbers grew by 5,000 in 2023.

See the full report here.

April 28, 2025 / Basic Needs, Equity, Food

Cuts to Federal Funding Could Deepen Poverty in Rural and Low-Income GeorgiaImage

A new analysis from the Georgia Budget and Policy Institute (GBPI) warns that proposed federal budget cuts could severely harm rural communities, low-income families, immigrants, and Georgians of color. Federal programs that help close long-standing gaps in access to health care, education, food, and economic security are now at risk as Congress debates budget reconciliation and appropriations bills ahead of a September 30, 2025 deadline.

Cuts to vital programs like SNAP, education funding, and rural health care are expected to hit hardest in Georgia’s poorest and most vulnerable communities, exacerbating hunger, poverty, and inequality across the state.

Key Takeaways:

  • Georgia ranks 14th in U.S. poverty rates, putting its rural and low-income populations at greater risk if federal funding is slashed.

  • Over 15% of Georgians living in poverty are either Black, Latino, or under 18, meaning federal cuts would disproportionately harm these communities.

  • Programs like SNAP are at risk, threatening food security for thousands of Georgians already living in rural food deserts.

  • Cuts could cost thousands of jobs statewide, particularly in education, health care, and social services sectors.

  • Tracking federal spending impacts is becoming harder, as the administration reduces public data availability, weakening transparency and accountability.

Read the full report here.

July 30, 2024 / Basic Needs, Housing

Results from 2024 PIT Count for the City of AtlantaImage

The PIT Count takes an annual, unduplicated census of people experiencing homelessness on a one night in the last 10 days of January. Note that the PIT Count covers only people who are either in shelters or unsheltered. Therefore, it should not be viewed as an exact number of people experiencing homelessness. However, it is a useful tool that can be used to estimate characteristics of the City of Atlanta population of people experiencing homelessness and gauge changes over time.

Of the 2,867 persons counted through Atlanta’s 2024 Point-In-Time survey:

  • 92% of families experiencing homelessness are Black.
  • 35% of adults experiencing homelessness are over the age of 55.
  • 61% don’t earn any income of any kind, and 72% of them don’t receive benefits or additional support.

Read the full report here.

May 20, 2024 / Basic Needs, Environment

Energy insecurity disproportionately affects communities of color in the Southeast statesImage

Earlier this month, the Southeast Energy Efficiency Alliance (SEEA) Research team published the Energy Insecurity StoryMap. The project explores the intricate connections between energy, housing, and financial policies contributing to disparities in our communities.

Some highlights:

  • The Southeast has the lowest electric rates in the contiguous United States but the greatest proportion of energy-insecure households.
  • Communities of color still lack of equal participation in energy decision-making processes and access to clean and affordable sources of energy.
  • Research shows that redlined areas still have higher energy use intensity, less access to green space, higher urban temperatures, increased density of oil and gas wells, and more fossil fuel power plants.

Explore the full StoryMap here.

There are 79 neighborhoods throughout Greater Atlanta with low and declining child well-beingImage

A few months ago, United Way of Greater Atlanta published the 2023 update of their Child Well-being Index. This data serves as a diagnostic tool to tell where each neighborhood is progressing toward saying that “all the children are well” and to guide how United Way directs its resources to most effectively improve child well-being and transform lives for the better.

Here are some key insights from this year’s update:

  • There are 79 neighborhoods throughout Greater Atlanta with low and declining child well-being.
  • Nearly 500,000 of Greater Atlanta’s 1.2 million children and youth live in high-need areas.
  • Data also shows that low child well-being scores disproportionately impact BIPOC populations.
  • Nearly 14,000 youth are not connected to school or work.
  • The overall regional score remained stable compared to 2018 – largely due to public and private funding and resources to offset damage from the pandemic. However, it is important to mention that since the data for the 2023 index scores was collected, these programs have largely ended.

Read the full report here.

November 28, 2023 / Basic Needs, Eviction, Housing

ULI Atlanta’s ‘Housing at its Core’ Study 2023 updateImage

ULI Atlanta’s housing study was first commissioned in 2017 and released in 2018 to understand the depth and scale of the affordable housing issue across the Atlanta region. The study sought to define the problem in both market and financial terms that appealed to practitioners and developers. The 2023 updated analysis highlights the region’s current challenges in providing affordable housing for all Atlanta regional households.

Some key takeaways:

  • Since 2018, all 5-County core households area grew by 9%. Growth in affordable cost-burdened households outpaced overall household growth – increasing 15%
  • The cost to subsidize the 390,000 households within the region who are currently cost-burdened and making at or below 80% AMI in the 5-County area is $270 million per month.
  • There is currently no ZIP code in the core counties where someone earning 80% or less than the area median income (AMI) can purchase a home at the median income price.

The study defines some of the problems in the affordability crisis to be: rents and home prices growing faster than incomes, cost burden persisting across the five counties, transportation remaining a significant cost, and inequity inhibiting housing choices.

Read the full report here

September 24, 2023 / Basic Needs, Economics, Equity, Inflation

U.S. Poverty Increased as pandemic-era programs endedImage

You may have noticed a drastic decrease in child poverty over the last couple of years. Now, you’ll see a dramatic increase as pandemic-era social safety net programs ended.

Based on the latest report on U.S. poverty by the census, the supplemental child poverty rate more than doubled, from 5.2 percent in 2021 to 12.4 percent in 2022.

The U.S. Census Bureau measures poverty in two ways every year. The first, called the official poverty measure, is based on cash resources. The second measure, the Supplemental Poverty Measure (SPM), includes both cash and noncash benefits and subtracts necessary expenses (such as taxes and medical expenses).

The report explains, “Social Security continued to be the most important antipoverty program in 2022, moving 28.9 million people out of SPM poverty. Meanwhile, refundable tax credits moved 6.4 million people out of SPM poverty, down from 9.6 million people in 2021”.

Charts are from The New York Times.

Homelessness in the U.S. has been on the rise since 2017, experiencing an overall increase of 6 percent.Image

The 2023 edition of the State of Homelessness report shows that, according to the January 2022 Point-in-Time (PIT) count, 582,462 people were experiencing homelessness across America. Using data from the U.S. Department of Housing and Urban Development (HUD), the National Alliance to End Homelessness provides an overview of the scope of the issue in the U.S., illustrating emerging trends. Some key facts:

  • Homelessness has been on the rise since 2017, experiencing an overall increase of 6 percent.
  • In 2022, counts of individuals (421,392 people) and chronically homeless individuals (127,768) reached record highs in the history of data collection.
  • Unsheltered rates are also trending upward, impacting most racial, ethnic, and gender subgroups.
  • Homeless services systems continued to expand the availability of both temporary and permanent beds in 2022, but these resources still fall short of reaching everyone in need.
  • Homelessness rose by a modest 0.3% from 2020 to 2022, a period marked by both pandemic-related economic disruptions and robust investments of federal resources into human services.

Explore Georgia’s COC dashboards here.

A note on the data: Point-in-time data are one of two common ways to quantify the homeless population. The other is through school districts as mandated by the Federal McKinney-Vento Act. Keep both sources and their definitions of homelessness in mind when analyzing this kind of data.

January 26, 2023 / Basic Needs, Housing

Demand for rental assistance on the riseImage

Based on 2-1-1 service requests, the demand for rental assistance has been on the rise through the holiday season. Service requests are largely concentrated in South Fulton zip codes.

Explore the data in the right panel of this page or with the full dashboard. This data is provided by United Way of Greater Atlanta and is updated monthly.

If you are in need of housing assistance or other services, call 2-1-1 or visit 211online.unitedwayatlanta.org.

December 12, 2022 / Basic Needs, Eviction, Housing, Policy

Eviction filings back to pre-pandemic levelsImage

Since the beginning of the pandemic, we’ve been tracking eviction filings from Metro Atlanta counties to understand the time and geographic trends.

It’s clear the federal moratoriums prevented the “eviction tsunami” we heard so much about in 2020 and 2021, but even after the moratoriums, a tidal wave never came.

But as we continue to track the data (currently through November 2022), we’ve seen filing levels steadily rise, matching pre-pandemic levels since late summer.

September 13, 2022 / Basic Needs, Economics, Policy, Workforce

Unprecedented decline in child poverty rates attributed to government safety net programsImage

A new report from Child Trends (also covered in the New York Times) evaluates the biggest factors contributing to the unprecedented 30-year trend of decreasing child poverty. Key findings point to governmental safety net programs as key drivers.

Further, the US Census Bureau released pandemic-era child poverty estimates (through 2021) this week, saying “the new data show the significant impact the expansion of anti-poverty programs during the COVID-19 pandemic had on reducing child poverty.”

Additional recent studies, including from our partners at DataHaven in Connecticut found that food scarcity and child poverty rose after safety net programs ended.

What does that mean for social sector leaders?

First, the scale of government interventions offer opportunities to have the greatest impact. But blanket policies will always leave some households falling through cracks: immigrants, mixed-status and undocumented households, families that are newly navigating human services, digitally disconnected, underemployed, housing burdened, and others. Our role then, is (1) advocate for expanded policies and educate officials of the impact; and (2) find and directly serve the families that are left behind.

Second, the new philanthropic role of counties and cities distributing ARPA funds offers an opportunity, and maybe a model, to (1) build relationships with elected officials and (2) provide guidance in funding and programming decisions that have systemic impacts.

May 11, 2022 / Basic Needs, Food, Inflation

Image

Both the pandemic and higher prices have increased reliance on nonprofits. The Atlanta Community Food Bank’s (ACFB) President and CEO Kyle Waide said, “The current challenges that we’re all experiencing with higher prices, for gas, for food, for supplies, are causing demand for food assistance to increase and it’s making it more expensive and more challenging for the food bank to respond to that demand.” With high inflation and increasing demand for their services, ACFB’s food costs are 30% higher this year than last year.

January 28, 2022 / Basic Needs, Equity, Housing

Preliminary findings from Atlanta’s recent homeless count indicate the pandemic likely exacerbated homelessness in the city.Insight

Atlanta recently conducted its annual “Point in Time” count to evaluate the number of homeless individuals in the city. The count was canceled in 2021 due to the pandemic, but 3,240 people were counted in the city of Atlanta in 2020. The official numbers for the 2022 count will not be released until later in the year, but recent trends have shown that the pandemic may have worsened homelessness. Recently, more people have been sleeping outdoors rather than in shelters. In Atlanta, there are 2,800 beds available in shelters, but many individuals have turned down a bed due to COVID-19 concerns. Another new trend has emerged: there are more individuals that are newly homeless than ever before. There is some good news, though. As many as 700 previously homeless individuals were able to secure stable housing with pandemic-relief funding.

Takeaway: Reducing homelessness in the wake of the pandemic will rely on improved housing aid and policy as well as creative sheltering options to safely house individuals.

December 10, 2021 / Basic Needs, Equity, Food

Despite economic gains in 2021, food bank use is up from 2020 in metro Atlanta.Gallery

This year’s Metro Atlanta Speaks (MAS) survey, the largest public opinion survey in the Atlanta region, showed that 23.9% of respondents reported receiving food from a food bank compared to 17.9% of respondents in 2020. United Way’s 2-1-1 call data, however, found that fewer people were calling to request information about food pantries in 2021 than at the start of the pandemic. Calls about food pantries peaked in March 2020 at 2,255 calls. Comparatively, food pantry calls averaged around 700 calls per month in 2021. This could indicate that many families were concerned about needing to use a food pantry after the initial shock of the pandemic, but actually continued to need assistance over one year into the pandemic. 

Takeaway: The increased use of food banks in 2021 indicates the need for a more aggressive approach to addressing income inequality.